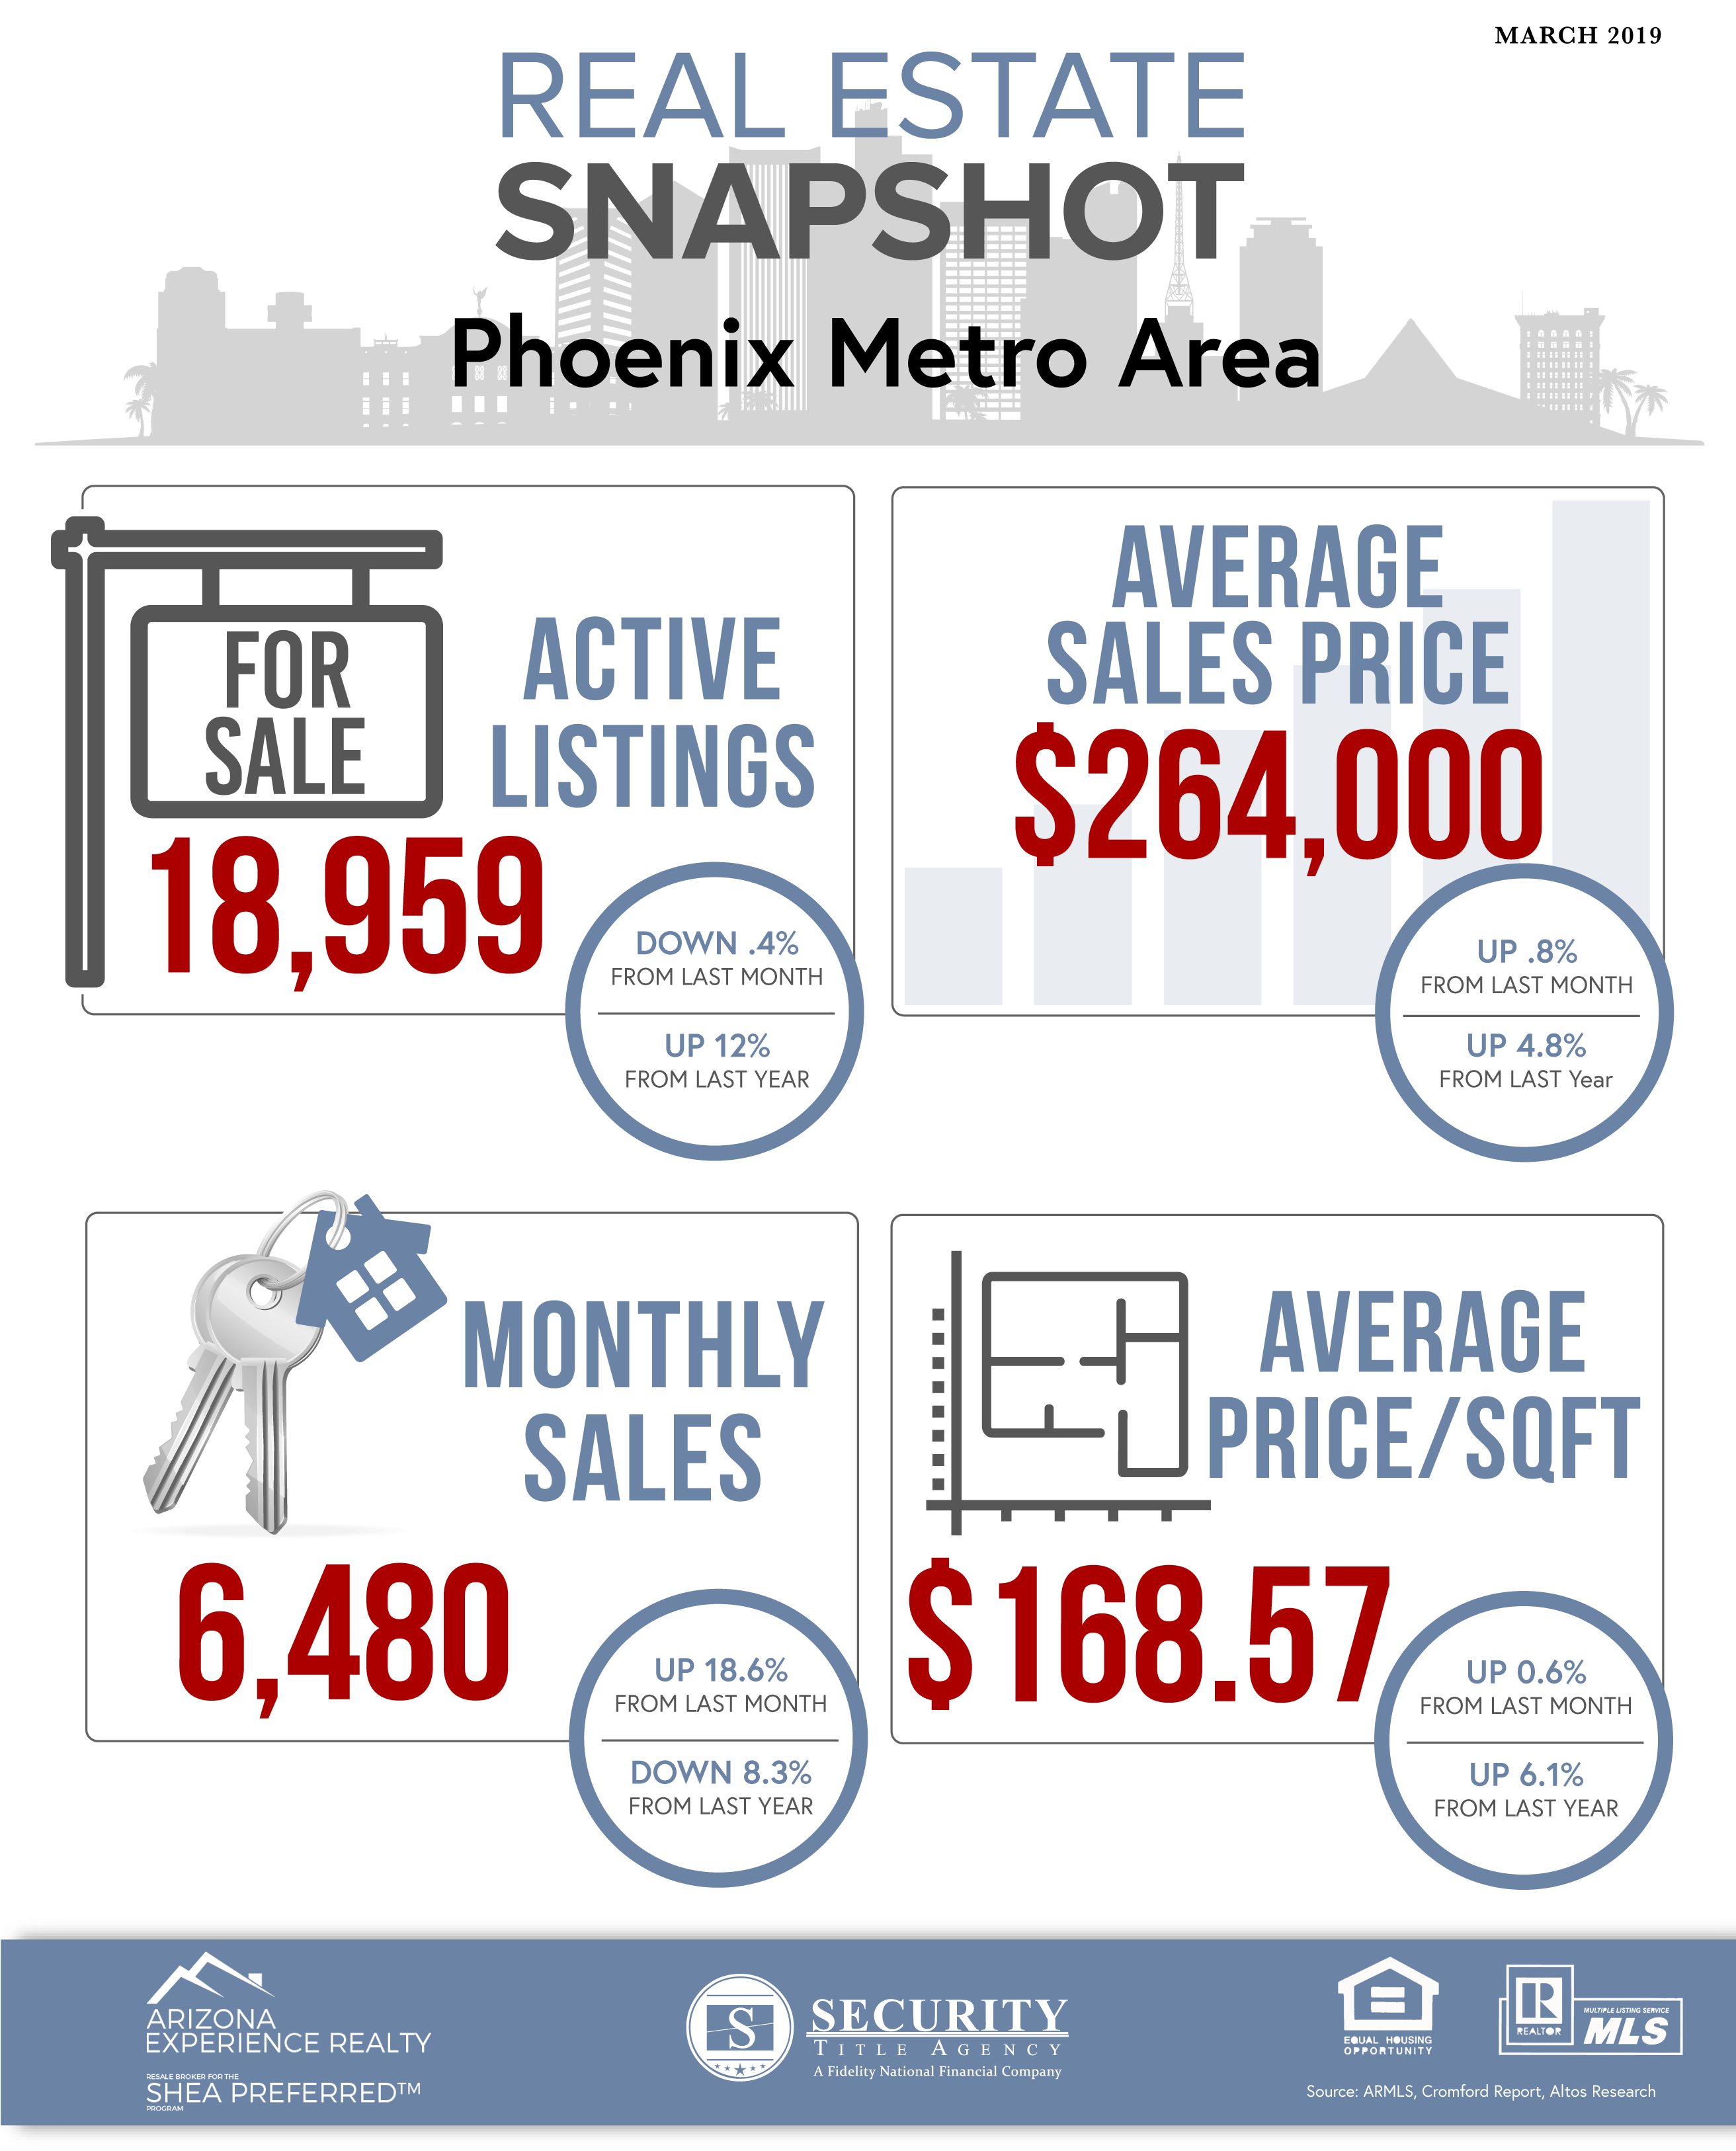
Starting with the basic ARMLS numbers for March 1, 2019 and comparing them with March 1, 2018 for all areas & types:
- Active Listings (excluding UCB): 18,959 versus 16,924 last year – up 12.0% – but down 0.4% from 19,040 last month
- Active Listings (including UCB): 23,197 versus 21,474 last year – up 8.0% – and up 2.4% compared with 22,655 last month
- Pending Listings: 6,119 versus 7,158 last year – down 14.5% – but up 22.1% from 5,012 last month
- Under Contract Listings (including Pending, CCBS & UCB): 10,357 versus 11,708 last year – down 11.5% – but up 20.1% from 8,627 last month
- Monthly Sales: 6,480 versus 7,067 last year – down 8.3% – but up 18.6% from 5,462 last month
- Monthly Average Sales Price per Sq. Ft.: $168.57 versus $167.59 last year – up 6.1% – and up 0.6% from $167.59 last month
Monthly Median Sales Price: $264,000 versus $252,000 last year – up 4.8% – and up 0.8% from $262,000 last month
The second half of February saw momentum building in the market, though it will need to build even more to catch up with last year when it was running on all cylinders.
Supply without a contract is up 8% from a year ago. However it has already declined between February 1 and March 1, something which usually only occurs in years when the market is doing rather well. That is just one of several good omens that suggest the weakness in demand that started in September is now dissipating.
Another positive sign is that sales increased by over 18% between January and February. This compares favorably with last year which gave us a 14.4% increase. The annual sales rate continues to fall, but the momentum of this trend is fading just a little.
Under contract listings grew over 20% since last month, Again this is better than in 2018 when the increase was 16.6%.
It is early days in the improving cycle so we should not get carried away with enthusiasm. Demand could fade again if we get a significant increase in loan interest rates. However, if this is signaled ahead of time, it could encourage buyers to make their minds up before the rates go into effect.
Anyone who is expecting prices to fall is likely to be very disappointed by the current state of affairs. Yes, asking prices are being cut at quite a high rate, but asking prices are often overly optimistic anyway, especially for homes that have just been listed.
Actual closed prices are looking very strong, as we can see in the numbers above. The mix is changing in favor of higher end homes too, since the low end below $200,000 remains chronically under-supplied. The usual upward cycle in average price per sq. ft. during the spring looks like it has turned up as usual in 2019.
The market looked uncertain at the end of January, but now we are seeing an upward trend in the Cromford® Demand Index and any day now we should see a mild declining trend in the Cromford® Supply Index. Both of these are good news for sellers and not-so-good for buyers.


